Data Storytelling is the process of creating a narrative around a dataset. This narrative can be used to inform, persuade, or entertain. It is a way to communicate the insights we’ve gained from our data to others.
TODAY’S GOALS
In Project Milestone 4, your group shared introductory material (eg: intro paragraphs, first viz, etc) and each individual pursued their own follow-up questions. Today, you’re going to:
Discuss & provide feedback on each student’s Project Milestone 4 viz.
Start combining your individual work into 1 cohesive story with a clear narrative.
Refine your data story through storyboard process.
In putting together a cohesive story, it’s important to think about both content (what you did and found in your data analysis) and narrative (how you deliver that content). Let’s focus on the narrative here. The following is an excerpt from a 2-author paper. What’s wrong with the narrative? (Focus on the big picture writing, not details about the plots or content.)
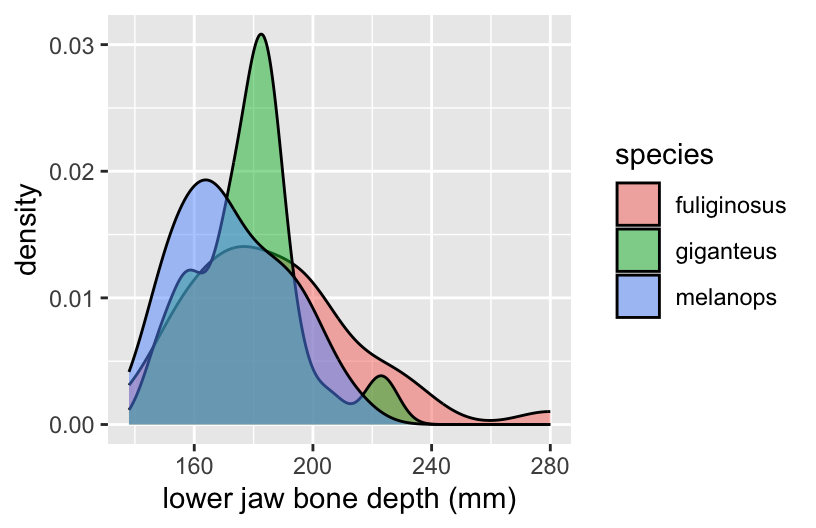
Kangaroos are the cutest! Here we focus on our 3 faves, the fuliginosus, giganteus, and melanops species. These buddies differ in many ways, including the depths of the lower jaw bones:
# Load data & packageslibrary(tidyverse)roos <-read.csv("https://ajohns24.github.io/data/kangaroos2.csv")# Plot lower jaw bone depthggplot(roos, aes(x = squamosal.depth, fill = species)) +geom_density(alpha =0.5) +labs(x ="lower jaw bone depth (mm)")
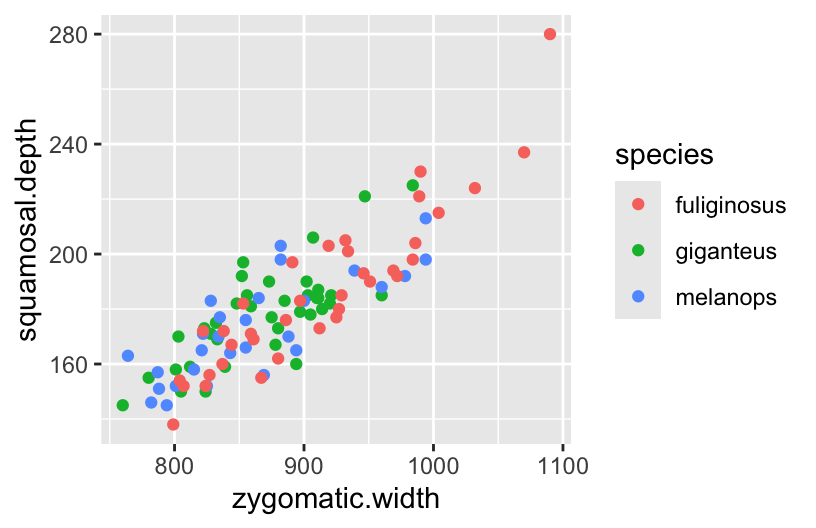
The researchers’ investigation into these Macropodidae species extended beyond their squamosal depths. Of primary interest was the relationships among various cranial features. For example, the researchers observed that squamosal depths tend to increase with zygomatic widths:
# Plot squamosal.depth vs zygomatic.widthggplot(roos, aes(y = squamosal.depth, x = zygomatic.width, color = species)) +geom_point()
EXAMPLE 2
To reiterate, in putting together a cohesive story, it’s important to think about both content (what you did and found in your data analysis) and narrative (how you deliver that content). The following is an excerpt from a 3-author paper. What’s wrong with the narrative?
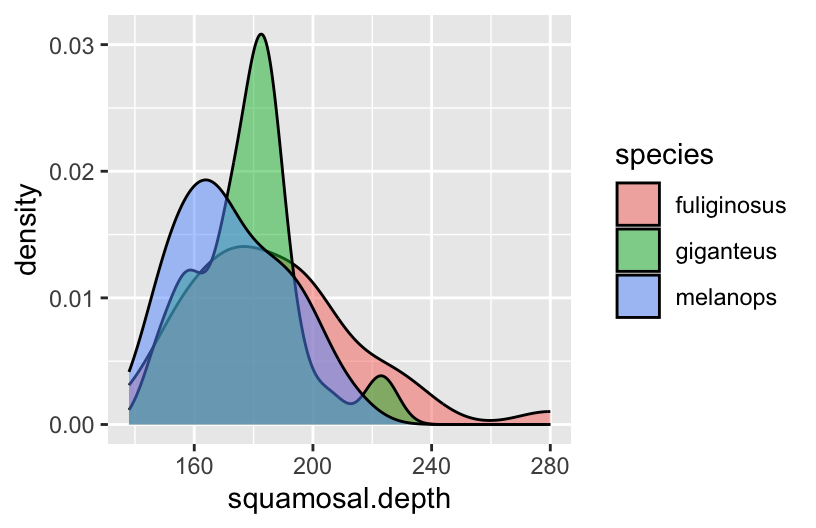
We first looked into how the lower jaw bone depth varies by kangaroo species. Though there are many similarities, melanops tend to have the smallest lower jaw bones and fuliginosus can have lower jaw bones that grow to be quite large in comparison:
# Load data & packageslibrary(tidyverse)roos <-read.csv("https://ajohns24.github.io/data/kangaroos2.csv")# Plot lower jaw bone depthggplot(roos, aes(x = squamosal.depth, fill = species)) +geom_density(alpha =0.5)
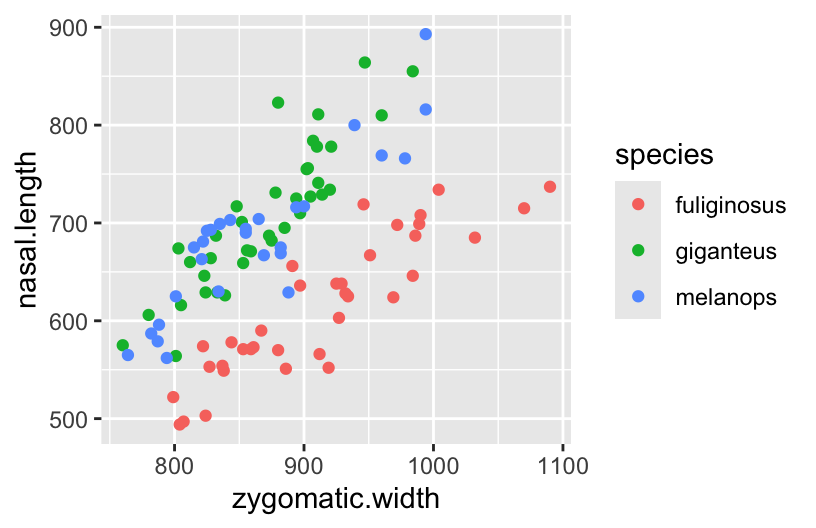
Though longer nasal bones are associated with wider cheekbones within each species, fuliginosus kangaroos tend to have narrower cheekbones relative to nasal length:
# Plot nasal length vs cheekbone widthggplot(roos, aes(y = nasal.length, x = zygomatic.width, color = species)) +geom_point()
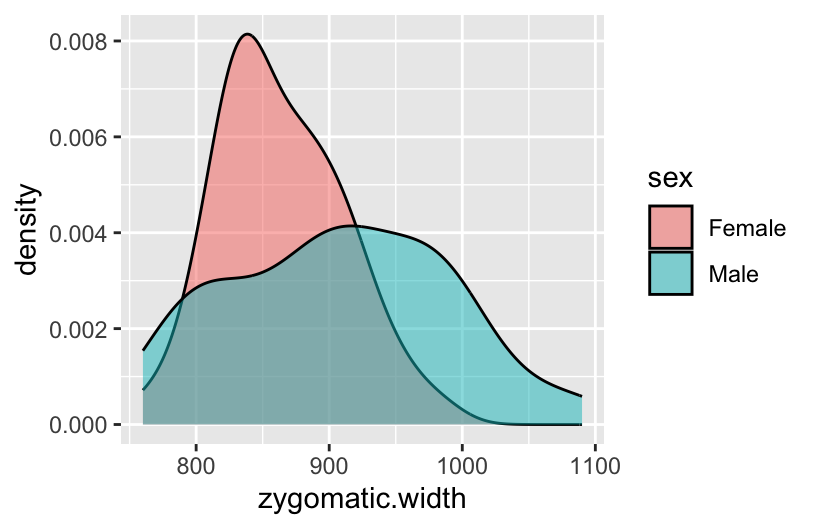
Finally, male kangaroos tend to have wider cheekbones:
# Plot cheekbone width by sexggplot(roos, aes(x = zygomatic.width, fill = sex)) +geom_density(alpha =0.5)
Cohesive data stories
To make a cohesive, multi-author story:
Mind the basics. Use consistent tense, style, and audience.
Connect the narrative! Avoid writing an “and then” story, i.e. a list of disconnected thoughts thrown into one place!
23.2 Activity
Exercise 1: Viz presentation & discussion
Complete the following for each person in your group:
Present the follow-up visualization you created for Milestone 4 (2 minutes). Make sure to cover:
motivation: what were you trying to learn? why?
observation: what is going on (variability / scale, trend / patterns, outliers)?
discussion: make meaning of your observations. why might this be happening?
Discuss as a group (5 minutes).
Comment on the effective features of the graphic.
Offer concrete suggestions for improving the visualization / making it more effective. Focus on growth here!
Discuss whether the plot inspires further follow-up questions.
Exercise 2: Combining your work
Now let’s combine your individual contributions into a cohesive group data story. Nolan and Stoudt lay out a 6-step process:
Collect tables and plots: gather all the relevant visuals and tables you’ve created
Group related findings: organize the visuals and tables into groups that tell a coherent story
Find the story: consider the connections between the groups and sequence the groups so you can tell a story
Choose tables and plots: select or design the most important visuals and tables to include in the final presentation
Sequence the tables and plots: consider the flow of details needed to understand the data and visuals
Add captions and transitions: write a summary for each plot and a description for why it matters
And one more step:
Streamline the code: remove redundancies (the same code shouldn’t appear more than once), use consistent coding & commenting styles, remove unnecessary code
Directions
Work through the above 6 steps in a way that makes sense for your group. Either:
Start a template for your final report. Use the above 6 steps to create an outline of your data story.
OR: Use a storyboarding technique. A storyboard is a series of illustrations or images displayed in sequence to depict important milestones and changes in the narrative.
Make a copy of this document for your project group.
Each person should:
copy the template slide [3rd slide]
insert a screenshot of a visual or table they’ve created for the project
add an “important message” at the top of each visual/table, i.e. a 1-sentence summary of what is the most insightful finding of the visual.
explain “why it matters” at the bottom of each visual/table, i.e. include a few sentence description of why the audience should care and what they might do with that insight
Discuss the order of the slides to tell the broader narrative.
Discuss what is missing from the current set of visuals/tables.
Exercise 3: Work on Project Milestone 5
This assignment is posted on Moodle.
23.3 Wrap-up
Upcoming due dates:
Thursday 12/5 (11:59pm): Project Milestone 5.
Tuesday 12/10 (5pm): Final project report and documentation
Saturday 12/14 (12pm): Final project reflection form due
Saturday 12/14 (1:30-3:30pm): Final presentations
Though you’re welcome to attend the full 2 hours, each group will be assigned to present (and be present) during a 1-hour block: