15 Logistic regression: Review
Announcements
Welcome back!
Homework 5 and Checkpoint 12 are due Thursday.
Quiz 2 is next Thursday. It is the same format as Quiz 1, it is (necessarily) cumulative, and it will cover material up through today (logistic regression).
I submitted midterm grades for everyone. On the syllabus, I also added additional pathways to an “A.” The original pathways (eg: score at least 80% on at least 80% of the checkpoints) were meant to provide flexibility in terms of making mistakes as you practice, and flexibility in terms of being able to miss some assignments. However, in some cases, students hadn’t met that exact goal but had met something in the same spirit (eg: score at least 80% overall on the checkpoints). Thus I added that as a pathway.
15.1 Practice exercises
Is it rude to recline your seat in an airplane / bus? (image: slate.com)

Using data collected by fivethirtyeight.com, we’ll explore the relationship between whether or not somebody believes reclining seats should be eliminated (true or false) by their height (in inches), age bracket, and their own reclining behavior.
# Load packages and data
library(ggplot2)
library(dplyr)
library(tidyr)
library(fivethirtyeight)
data(flying)
# Clean up the age variable and convert height to inches
# Keep only the data on recline_eliminate, age, and height
flying <- flying %>%
select(recline_eliminate, recline_frequency, age, height) %>%
mutate(age = as.factor(as.character(age)),
recline_frequency = as.factor(as.character(recline_frequency))) %>%
separate(height, into = c('feet', 'inches'), convert = TRUE) %>%
mutate(height = 12*as.numeric(feet) + as.numeric(inches)) %>%
na.omit()
head(flying)
## # A tibble: 6 × 6
## recline_eliminate recline_frequency age feet inches height
## <lgl> <fct> <fct> <chr> <int> <dbl>
## 1 FALSE About half the time 30-44 6 3 75
## 2 FALSE Usually 30-44 5 8 68
## 3 FALSE Always 30-44 5 11 71
## 4 FALSE About half the time 30-44 5 7 67
## 5 FALSE Usually 30-44 5 9 69
## 6 TRUE Once in a while 30-44 6 2 74
EXAMPLE 1
# How many people do and don't think that reclining seats should be eliminated?
EXAMPLE 2: logistic regression model
Run the code below to model recline_eliminate by age, height, and recline_frequency.
flying_model <- glm(recline_eliminate ~ height + age + recline_frequency, data = flying, family = "binomial")
coef(summary(flying_model))
##                                     Estimate Std. Error   z value     Pr(>|z|)
## (Intercept)                      -4.51427661 1.51678836 -2.976207 2.918375e-03
## height                            0.05188502 0.02230209  2.326464 1.999379e-02
## age18-29                         -0.88667284 0.25479614 -3.479931 5.015439e-04
## age30-44                         -0.64412879 0.23578505 -2.731848 6.298028e-03
## age45-60                         -0.31470028 0.22782947 -1.381298 1.671875e-01
## recline_frequencyAlways          -0.90432987 0.38820972 -2.329488 1.983323e-02
## recline_frequencyNever            2.17994005 0.29549589  7.377226 1.616212e-13
## recline_frequencyOnce in a while  0.80412317 0.27528597  2.921047 3.488575e-03
## recline_frequencyUsually         -0.46533358 0.32758686 -1.420489 1.554653e-01
Why are we using a logistic regression model here?
What is the start of the correct model formula:
??? = -4.514 + 0.052 height…..
EXAMPLE 3: Interpretations
Interpret the age18-29 and height coefficients.
coef(summary(flying_model))
##                                     Estimate Std. Error   z value     Pr(>|z|)
## (Intercept)                      -4.51427661 1.51678836 -2.976207 2.918375e-03
## height                            0.05188502 0.02230209  2.326464 1.999379e-02
## age18-29                         -0.88667284 0.25479614 -3.479931 5.015439e-04
## age30-44                         -0.64412879 0.23578505 -2.731848 6.298028e-03
## age45-60                         -0.31470028 0.22782947 -1.381298 1.671875e-01
## recline_frequencyAlways          -0.90432987 0.38820972 -2.329488 1.983323e-02
## recline_frequencyNever            2.17994005 0.29549589  7.377226 1.616212e-13
## recline_frequencyOnce in a while  0.80412317 0.27528597  2.921047 3.488575e-03
## recline_frequencyUsually         -0.46533358 0.32758686 -1.420489 1.554653e-01
EXAMPLE 4: Model evaluation
Calculate the overall accuracy, sensitivity (true positive rate), and specificity (true negative rate) of this model.
library(regclass)
confusion_matrix(flying_model)
##              Predicted FALSE Predicted TRUE Total
## Actual FALSE             520             57   577
## Actual TRUE              147            107   254
## Total                    667            164   831

# Overall accuracy


# Sensitivity


# Specificity
EXAMPLE 5: Visualizations
# Check out the relationship between recline_eliminate and height
flying %>%
  group_by(height) %>%
  summarize(rude_rate = mean(recline_eliminate)) %>%
  ggplot(aes(x = height, y = rude_rate)) +
    geom_point()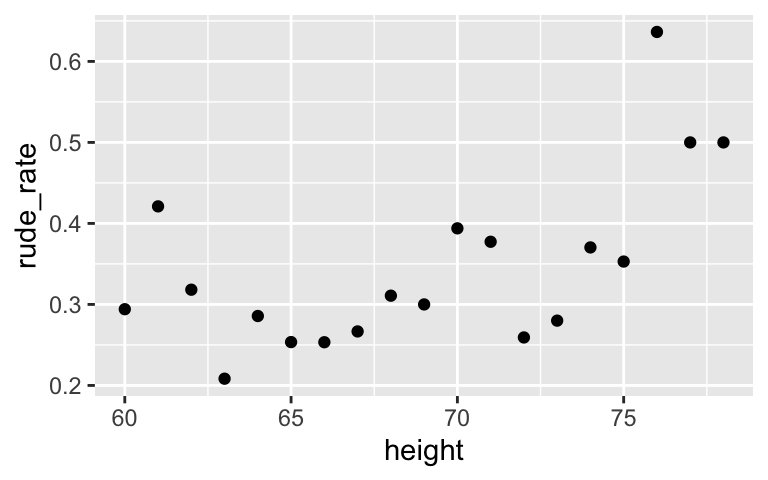
# Attempt 1
# Check out the relationship between recline_eliminate and age bracket
ggplot(flying, aes(x = age, fill = recline_eliminate)) +
    geom_bar()
# Attempt 2
# Check out the relationship between recline_eliminate and age bracket
ggplot(flying, aes(x = age, fill = recline_eliminate)) +
    geom_bar(position = "fill")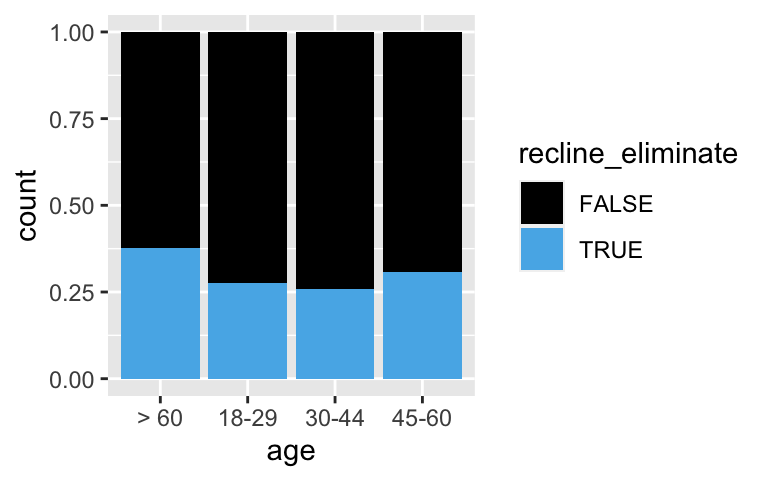
# Attempt 1
# Check out the relationship between recline_eliminate and recline_frequency
ggplot(flying, aes(x = recline_frequency, fill = recline_eliminate)) +
    geom_bar()
# Attempt 2
# Check out the relationship between recline_eliminate and age bracket
ggplot(flying, aes(x = recline_frequency, fill = recline_eliminate)) +
    geom_bar(position = "fill")
EXAMPLE 6: Predictions
Calculate the probability that a 6 foot (i.e. 72 inch) 20-year-old that never reclines their own seat thinks that reclining seats should be eliminated. Though you can check your answer using the predict() function, you should try this by hand first.
coef(summary(flying_model))
##                                     Estimate Std. Error   z value     Pr(>|z|)
## (Intercept)                      -4.51427661 1.51678836 -2.976207 2.918375e-03
## height                            0.05188502 0.02230209  2.326464 1.999379e-02
## age18-29                         -0.88667284 0.25479614 -3.479931 5.015439e-04
## age30-44                         -0.64412879 0.23578505 -2.731848 6.298028e-03
## age45-60                         -0.31470028 0.22782947 -1.381298 1.671875e-01
## recline_frequencyAlways          -0.90432987 0.38820972 -2.329488 1.983323e-02
## recline_frequencyNever            2.17994005 0.29549589  7.377226 1.616212e-13
## recline_frequencyOnce in a while  0.80412317 0.27528597  2.921047 3.488575e-03
## recline_frequencyUsually         -0.46533358 0.32758686 -1.420489 1.554653e-01
15.2 Solutions
EXAMPLE 1
# How many people do and don't think that reclining seats should be eliminated?
flying %>%
    count(recline_eliminate)
## # A tibble: 2 × 2
##   recline_eliminate     n
##   <lgl>             <int>
## 1 FALSE               577
## 2 TRUE                254
EXAMPLE 2: logistic regression model
- The
recline_eliminateresponse variable is binary. - log(odds of wanting to eliminate reclining seats) = -4.514 + 0.052 height…..
EXAMPLE 3: Interpretations
When controlling for height and reclining behavior, the odds of an 18-49 year-old wanting to eliminate reclining seats are 41% as high as the odds for 60+ year-olds.
When controlling for age and reclining behavior, the odds of wanting to eliminate reclining seats increase by 5% for every additional inch in height.
exp(-0.887)
## [1] 0.4118896
exp(0.052)
## [1] 1.053376
EXAMPLE 4: Model evaluation
Calculate the overall accuracy, sensitivity (true positive rate), and specificity (true negative rate) of this model.
library(regclass)
confusion_matrix(flying_model)
##              Predicted FALSE Predicted TRUE Total
## Actual FALSE             520             57   577
## Actual TRUE              147            107   254
## Total                    667            164   831

# Overall accuracy
(520 + 107) / 831
## [1] 0.7545126

# Sensitivity
107 / 254
## [1] 0.4212598

# Specificity
520 / 577
## [1] 0.9012132
EXAMPLE 5: Visualizations
# Check out the relationship between recline_eliminate and height
flying %>%
  group_by(height) %>%
  summarize(rude_rate = mean(recline_eliminate)) %>%
  ggplot(aes(x = height, y = rude_rate)) +
    geom_point()
# Attempt 1
# Check out the relationship between recline_eliminate and age bracket
ggplot(flying, aes(x = age, fill = recline_eliminate)) +
    geom_bar()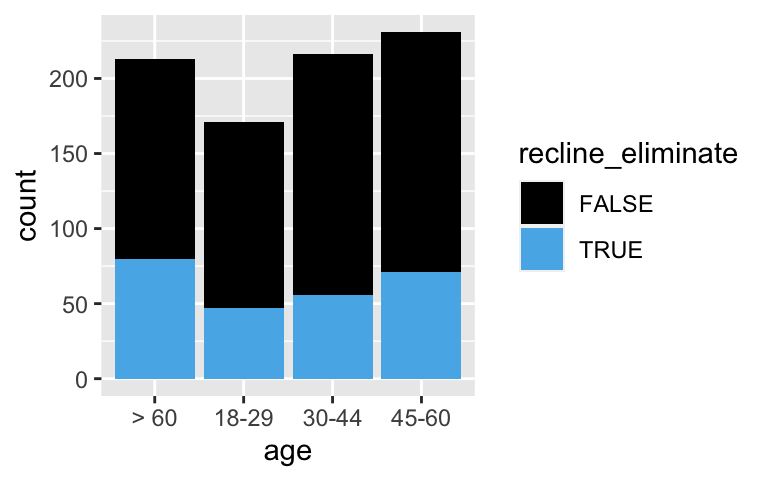
# Attempt 2
# Check out the relationship between recline_eliminate and age bracket
ggplot(flying, aes(x = age, fill = recline_eliminate)) +
    geom_bar(position = "fill")
# Attempt 1
# Check out the relationship between recline_eliminate and recline_frequency
ggplot(flying, aes(x = recline_frequency, fill = recline_eliminate)) +
    geom_bar()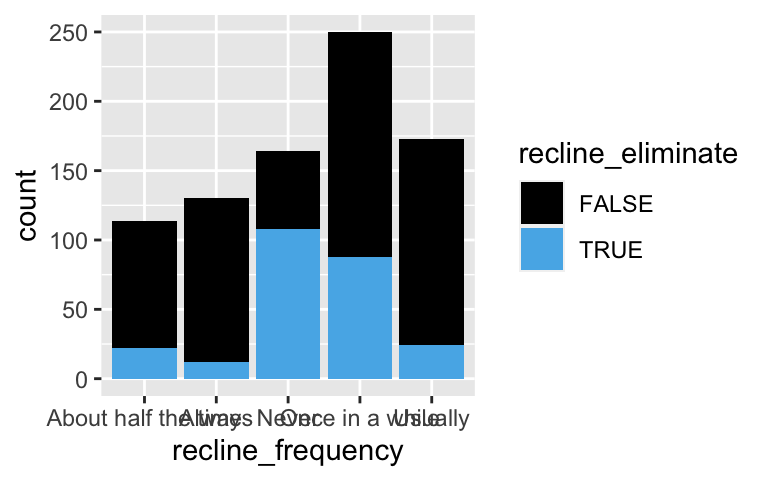
# Attempt 2
# Check out the relationship between recline_eliminate and age bracket
ggplot(flying, aes(x = recline_frequency, fill = recline_eliminate)) +
    geom_bar(position = "fill")
EXAMPLE 6: Predictions
Calculate the probability that a 6 foot (i.e. 72 inch) 20-year-old that never reclines their own seat thinks that reclining seats should be eliminated.
# log(odds)
-4.514 + 0.052*72 - 0.887 + 2.180
## [1] 0.523

# odds
exp(0.523)
## [1] 1.687081

# probability
exp(0.523) / (1 + exp(0.523))
## [1] 0.627849

# check using the predict function
predict(flying_model, newdata = data.frame(height = 72, age = "18-29", recline_frequency = "Never"), type = "response")
##         1
## 0.6259104