1 Welcome to class!
Statistical Modeling is the art and science of turning data into information. This doesn’t happen in a vacuum. In STAT 155, you will learn how to use this lens in a way that complements and enhances your expertise and experiences in other areas. Just a few examples:
- Statisticians use statistics!
- Louisa Bradtmiller, Environmental Studies
“Paleodust variability since the Last Glacial Maximum and implications for iron inputs to the ocean” - Morgan Jerald, Psychology
“Controlling images: How awareness of group stereotypes affects Black women’s well-being.” - Dennis Cao, Chemistry, and Sarah Boyer, Biology
“Nuptial gift chemistry reveals convergent evolution correlated with antagonism in mating systems of harvestmen (Arachnida, Opiliones)” - Sarah West, Economics
“Public Transit and Urban Redevelopment: The Effect of Light Rail Transit on Land Use in Minneapolis, Minnesota”
- John Kim, Media & Cultural Studies
data-driven art - Mac’s admissions department uses data to help anticipate enrollments
- Mac’s athletic department uses data to better understand sleep, outcomes, etc
This class is designed for you.
STAT 155 is a non-traditional introduction to statistics designed for both non-majors taking this as a terminal course, and majors that will go on to do more statistics.
STAT 155 emphasizes statistical applications and intuition over theory (we won’t be memorizing formulas). By doing so, you’ll get to explore sophisticated tools that typically aren’t covered until a second course in statistics.
To focus on applications and intuition, we’ll utilize statistical software (R/RStudio). This is how statistics is done outside the classroom, thus is a marketable skill. (It’s also assumed that you are totally new to RStudio.)
We’ll explore statistics and its potential impacts, ethical and otherwise, within context.
1.1 Introductions
Directions
Complete the following anonymous survey.
While I organize the data, meet the people in your breakout room. Share your names, gender pronouns, and whatever else you want to talk about! For example:
- What classes are you taking?
- What did you do over break?
- How are you feeling about the semester?
- What’s been your experience with stats / math? Are you trying something new?
Decide who will share their screen.
1.2 Exercises
Goals
- Learn more about the people in this classroom.
- Establish some foundational concepts of turning data into information.
- Focus on the big picture – no need to take notes!
- What do data look like?
Below is a snippet of the data from our STAT 155 survey. These data appear in a tidy format.- Each horizontal row corresponds to a unit of observation or case. What are the “units of observation” in the data here?
- Each vertical column corresponds to a variable. Name 1 quantitative (numerical) variable and 1 categorical variable in this data.
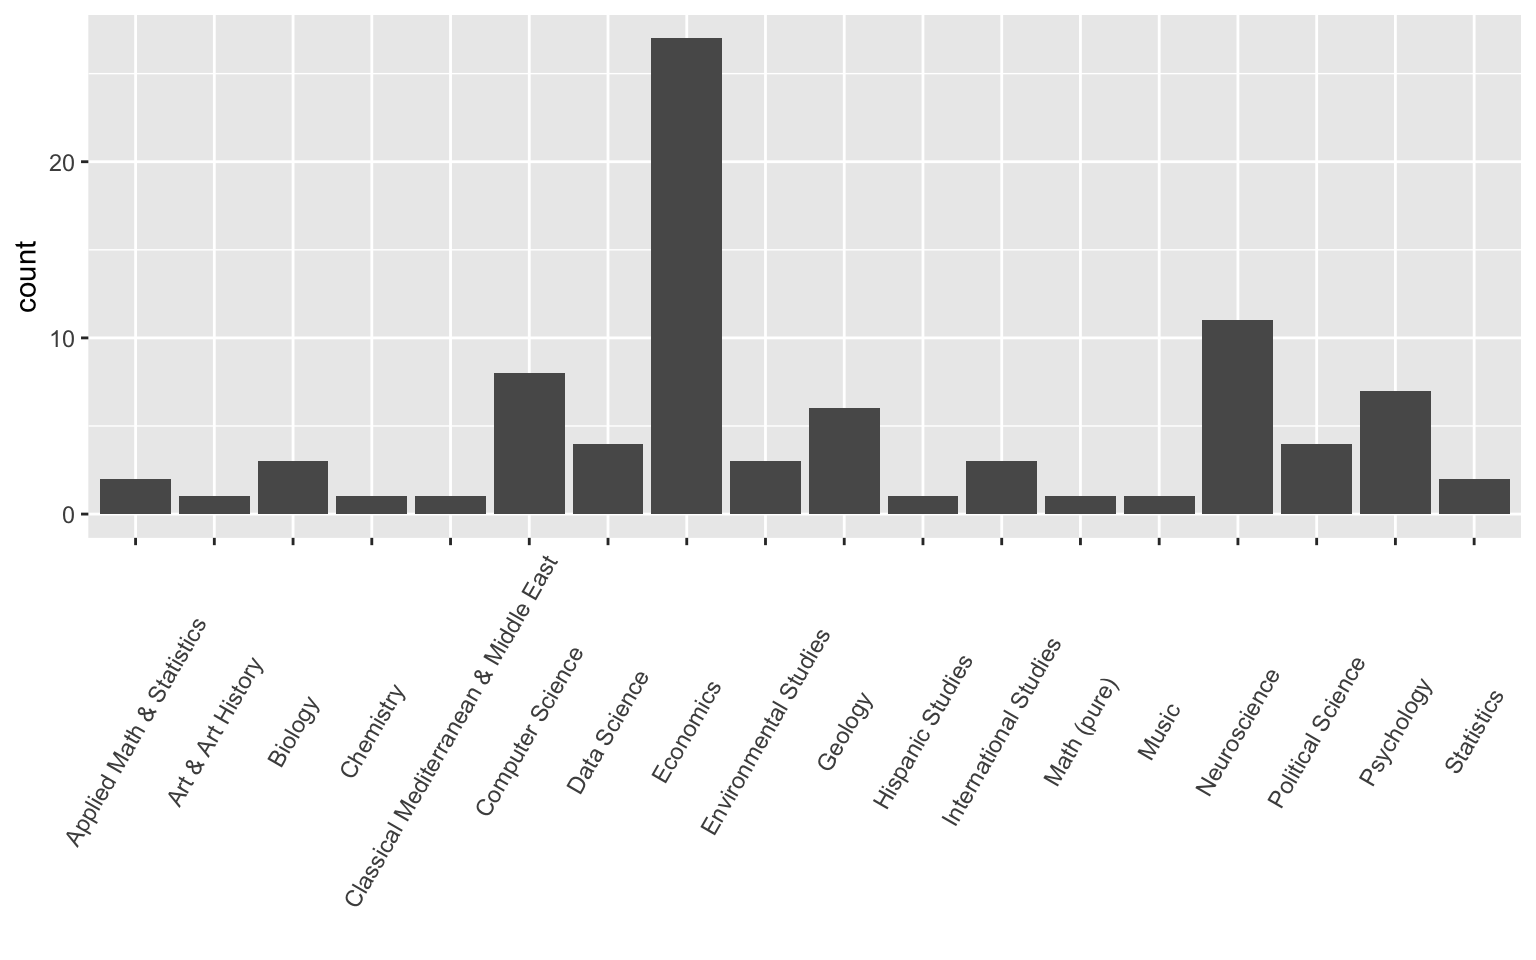
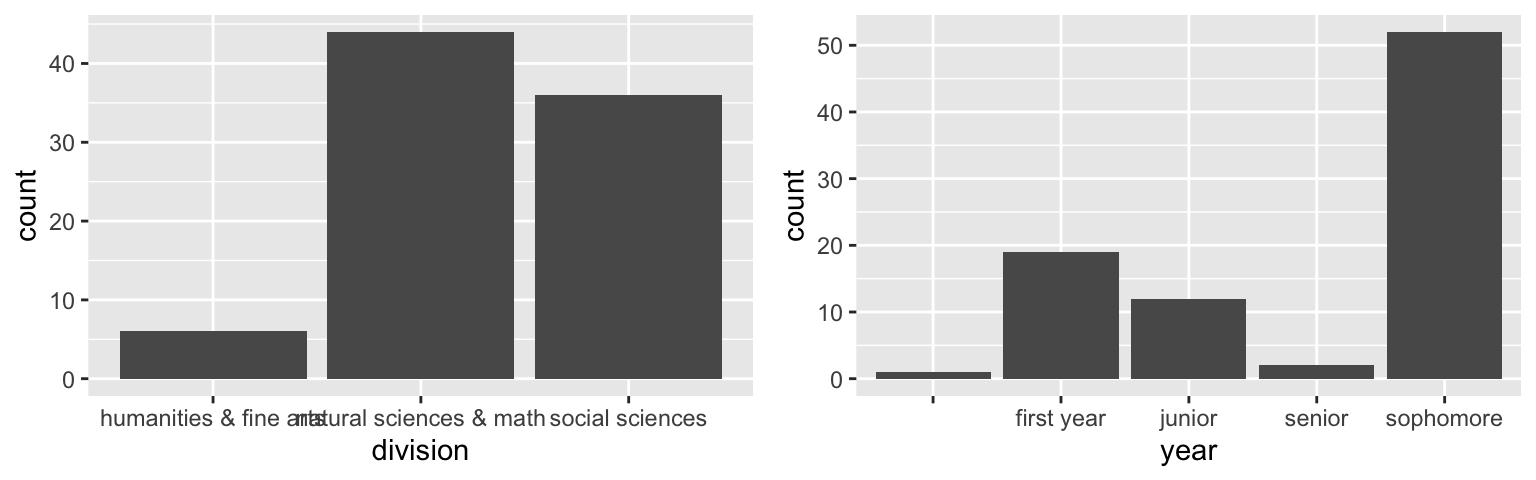
- Academic interests
- Check out the plots of students’ majors, major divisions, and years in school.
- Summarize what you learned about the students in this class.
- Suppose a researcher wants to use these data to learn about the academic interests among the broader Mac student body. Why should you caution them against it?
- Relationships
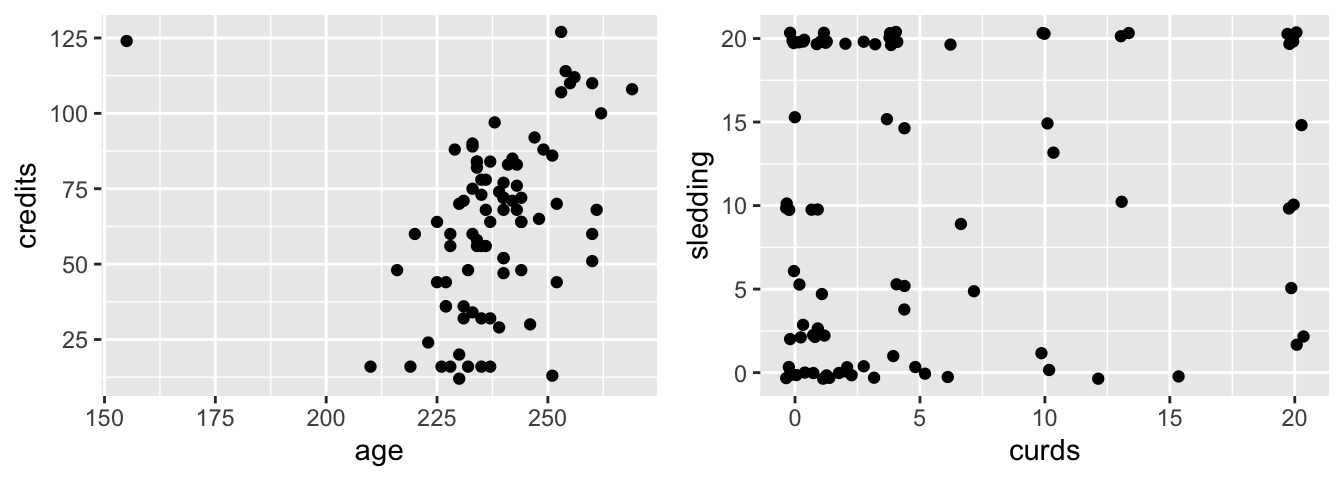
- Check out the relationship between the number of
creditssomebody has earned (y-axis) vs theiragein months (x-axis). Describe what you observe. - Check out the relationship between how many times a student has gone
sledding(y-axis) and how many times they’ve eaten cheesecurds(x-axis). Describe what you observe. - Suppose we observed above that students who’ve eaten more cheese curds tend to sled more. Why wouldn’t we be justified in trying to promote more sledding by giving out free cheese curds?
- Check out the relationship between the number of
- Conclusions
- Check out breakdown in students’
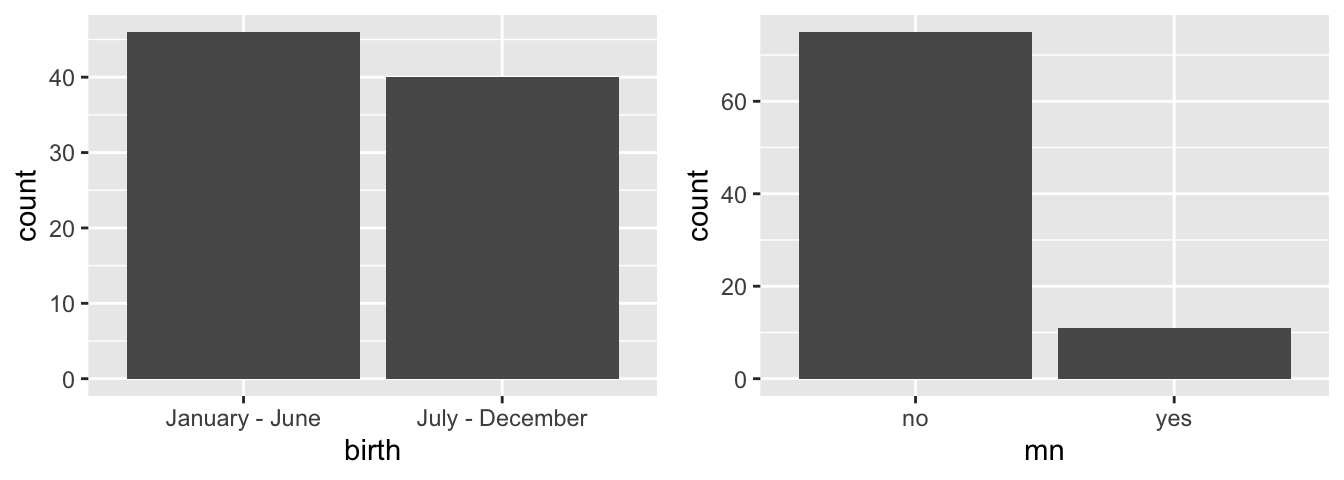
birthmonths. Did you observe that more students are born in the 1st half of the year or the 2nd? Assuming that this class is representative of the broader student body, does this provide substantial evidence of a broader birth trend at Mac? - Check out the breakdown in whether students lived in MN before attending Mac. Did less than half of the students in this class live in MN before? Assuming that this class is representative of the broader student body, does this provide substantial evidence that less than half of Mac students lived in MN before?
- Check out breakdown in students’
- Data ethics
We’ll discuss several ethical considerations around data collection and analysis throughout the semester. Consider just one today: data anonymity vs data privacy.- Was the data collection process anonymous?
- Did this data collection process maintain privacy for the respondents? If not, provide an example.
1.3 Wrap-up: Data principles
The exercises above help illustrate some important data principles.
Data collection
Sampling bias occurs when a sampling method produces samples that are not representative of the population of interest, thus can produce biased results. Example: Our STAT 155 sample would produce a biased understanding of Mac students’ academic interests.1
Data analysis
correlation vs causation
An observational study in which data are observed with NO manipulation of the subjects’ environment may reveal a correlation/association. However, cause-and-effect must be established via a controlled experiment (or causal inference tools). Example: There’s no cause-and-effect relationship between sledding and cheese curds.2
- exploratory vs inferential questions
- Exploratory question: What did we observe among our sample data?
(eg: did less than half of students in our class live in MN before?) - Inferential question: From this, what can we conclude about the broader population?
(eg: can we conclude from our data that less than half of Mac students lived in MN?)
- Exploratory question: What did we observe among our sample data?
Data ethics
We must always ask:
- How / by whom / why were these data collected?
- How are the data being used?
- What are the implications of the data analysis, both individual and societal?
1.4 Syllabus highlights
Here are a few quick highlights from the syllabus.
- This class is for everyone.
Thriving in STAT 155 is NOT correlated with the following: your major, whether you think you’re a “math person,” whether you have any previous idea what “statistical modeling” is, how many mistakes you make in our statistical software (you’ll make a lot!!!), etc. It IS correlated with effort, engagement, and contributing to a welcoming learning community.
- Preceptors
There are four awesome preceptors for this course. They bring their own unique 155 learning experiences, lived experiences, and academic backgrounds (2 are majors outside the department).
- Structure: flipped, active, and collaborative
- Before class, you’ll typically watch a short video which introduces new content and take a low-stakes checkpoint quiz on this content. Why? This helps us establish a common understanding and maximize our time together.
- During class you’ll dig deeper and explore concepts through in-class activities. Why? You’ll build a deeper understanding than if you listened to me lecture and didn’t get to experiment.
- After class you’ll practice and build upon these concepts through roughly weekly homework. Why? Practice is critical to absorbing content, building confidence with the material, and longer-term retention.
- Throughout, you’ll be working in groups during class and on a mini-project. Why? Collaboration is critical in statistics and, in general, the world.
- Communication
Outside of class, we’ll communicate using Slack. Why? Slack is more informal and inclusive than email or Moodle. Further, with more than 80 students in my sections of 155, communication will be more efficient.
- Grading & flexibility
- I provide universal and transparent flexibility (eg: each student has optional extensions on each homework).
- The grading system is based around the understanding that: (1) mistakes are expected; and (2) your mental / physical / emotional health, as well as your workload, might fluctuate throughout the semester. For example, some of your lowest scores are essentially dropped.
- Schedule
- Keep up to date with the course calendar and day-by-day schedule in the online manual.
- For Tuesday:
- Complete the “Get up and running activity”.
- Complete Checkpoint 1 by 930am. This is longer than the typical checkpoint.
- On Tuesday, we’ll be back on zoom for an RStudio workshop day.
- Between now and then, ask questions on Slack and in office hours.
- If you have been approved from the waitlist…
Assuming you attended the first class, I will enter an override on DegreeWorks so that you can register after class. Be sure to do this asap – you’re not officially enrolled in this class until you register!
photo credits: De Evan-Amos - Trabajo propio, Dominio público, https://commons.wikimedia.org/w/index.php?curid=11926907 and David Adam Kess, CC BY-SA 4.0 https://creativecommons.org/licenses/by-sa/4.0, via Wikimedia Commons↩︎
photo credit: @Claire_M↩︎