3 Conditional probability experiment
Directions
- Don’t talk with your neighbors.
- You’ll be given 2 minutes to answer the question on your slip of paper. The original source of these questions are Mother Jones magazine.
- Anonymously record your answer in the Google form linked on Moodle.
YOU WERE GIVEN 1 OF THE FOLLOWING 4 SCENARIOS
SCENARIO A
A group of researchers developed a new cream to treat skin rashes. They enrolled 426 patients in a study. The following table summarizes their findings:
| . | Rash got worse | Rash got better | Total |
|---|---|---|---|
| Used cream | 223 | 75 | 298 |
| Did not use cream | 107 | 21 | 128 |
| Total | 330 | 96 | 426 |
Question: What results does the study support?
- People who used the cream were more likely to get better than those who didn’t.
- People who used the cream were more likely to get worse than those who didn’t.
SCENARIO B
A group of researchers developed a new cream to treat skin rashes. They enrolled 426 patients in a study. The following table summarizes their findings:
| . | Rash got better | Rash got worse | Total |
|---|---|---|---|
| Used cream | 223 | 75 | 298 |
| Did not use cream | 107 | 21 | 128 |
| Total | 330 | 96 | 426 |
Question: What results does the study support?
- People who used the cream were more likely to get worse than those who didn’t.
- People who used the cream were more likely to get better than those who didn’t.
SCENARIO C
A group of researchers studied 426 cities to determine the effectiveness of laws that ban concealed handguns. The following table summarizes their findings:
| . | Crime increased | Crime decreased | Total |
|---|---|---|---|
| Handguns banned | 223 | 75 | 298 |
| Handguns not banned | 107 | 21 | 128 |
| Total | 330 | 96 | 426 |
Question: What results does the study support?
- Cities that banned handguns were more likely to see a decrease in crime than those who didn’t.
- Cities that banned handguns were more likely to see an increase in crime than those who didn’t.
SCENARIO D
A group of researchers studied 426 cities to determine the effectiveness of laws that ban concealed handguns. The following table summarizes their findings:
| . | Crime decreased | Crime increased | Total |
|---|---|---|---|
| Handguns banned | 223 | 75 | 298 |
| Handguns not banned | 107 | 21 | 128 |
| Total | 330 | 96 | 426 |
Question: What results does the study support?
- Cities that banned handguns were more likely to see an increase in crime than those who didn’t.
- Cities that banned handguns were more likely to see a decrease in crime than those who didn’t.
BACKGROUND
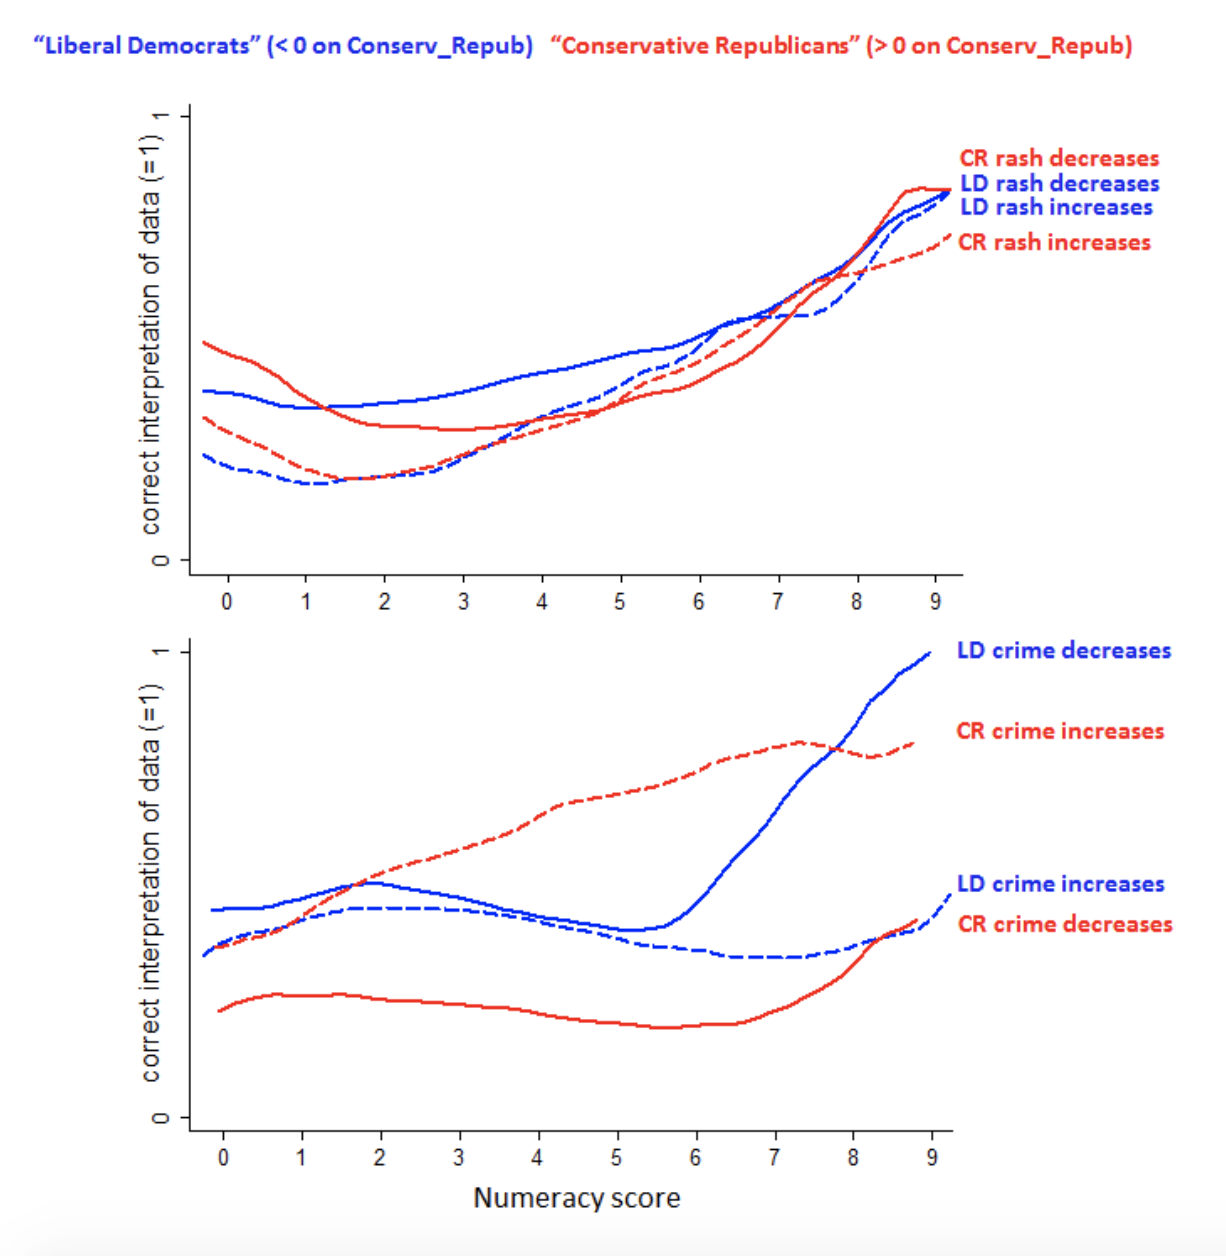
Do politics wreck our ability to do math?! A story in Mother Jones suggests just that. Researchers gave subjects 1 of 4 scenarios related to either rash cream or handgun bans. Each scenario used the same numbers though with a different interpretation. In 1 scenario the cream made rashes better, in 1 it made rashes worse. In 1 scenario handgun bans were associated with decreases in crime, in 1 they were associated with increases. The rate at which the correct answer was given varied by scenario and subjects’ underlying politics! Key takeaways:
When asked about skin creams, the accuracy rate was consistent across the political spectrum & study result (ie. whether rashes got better or worse with the cream.)
When asked about handgun bans, the accuracy rate drastically differed across the political spectrum & study result. For example, liberal democrats were much more likely to get the correct answer when the study results supported the conclusion that handgun bans lead to decreases in crime. Similarly, conservative republicans were much more likely to get the correct answer when the study results supported the conclusion that handgun bans don’t lead to decreases in crime.